
")
How to Read Crypto Charts for Beginners (Complete Step-by-Step Guide)
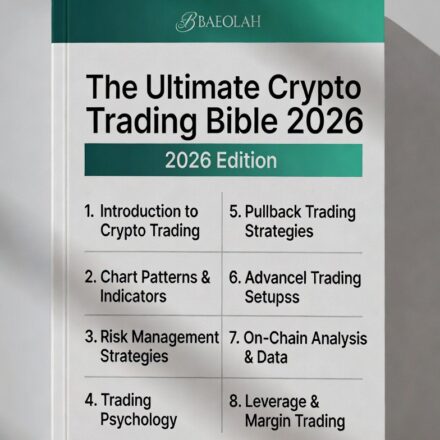
How to Read Crypto Charts for Beginners (Complete 2026 Step-by-Step Guide)
Mastering crypto charts is the difference between gambling and trading with edge. Charts reveal the real story: supply vs. demand, institutional footprints, retail FOMO, and fear-driven capitulation.
After nearly a decade navigating bull runs, brutal bears, and sideways grinds, one thing stands clear: chart-literate traders endure. Emotional traders fade away.
This premium guide delivers a structured, no-fluff path from beginner confusion to confident chart reading.
Start with our Free Crypto Trading Course — zero hype, real skills.
1. What Crypto Charts Actually Represent
A chart isn’t random squiggles. It visualizes millions of real-time decisions — every trade, every order, every emotion.
Rising price = buyers in temporary control. Falling price = sellers dominating.
Trading success comes from reading probability, not certainty. Charts give you the evidence.
Track live prices and structure on our real-time crypto dashboard.
2. Choose the Right Chart Type
Focus on one: Candlesticks. They deliver the most actionable insight with minimal clutter.
- Line charts → too basic (only closes)
- Bar charts → informative but visually noisy
- Candlesticks → gold standard for pros
3. Candlestick Anatomy – Master the Basics
Every candle tells a mini-story:
- Body: Open → Close range (bullish green/red = bearish)
- Wicks: Price rejection extremes
- Long lower wick → buyers defended lower prices aggressively
- Long upper wick → sellers rejected higher levels
4. Timeframes – See the Full Picture
Use multiple timeframes for context:
- Daily / 4H → primary trend & structure
- 1H / 15M → precise entries
- Weekly → macro cycle view
Rule: Higher timeframe bias → lower timeframe execution.
5. Market Structure – The Foundation
Structure reveals who controls the market.
- Bullish: Higher Highs (HH) + Higher Lows (HL)
- Bearish: Lower Highs (LH) + Lower Lows (LL)
- Range: Price oscillates between clear zones
Trade with structure — never against it blindly.
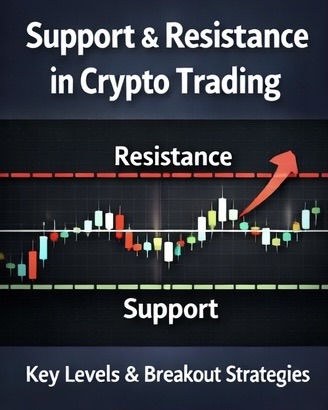
6. Support & Resistance – Zones, Not Lines
These are battlegrounds where price reacted before.
- Support → buyers stepped in previously
- Resistance → sellers defended
- Broken resistance → new support (role reversal)
Think zones (not razor-thin lines). Price rarely stops at exact levels.
7. Volume – The Confirmation Filter
Price tells you what. Volume tells you how much conviction.
- High-volume breakout → likely real
- Low-volume rally → weak, probable fakeout
8. Liquidity Grabs & Aggressive Moves
Price hunts liquidity: clusters of stops and pending orders.
Common traps:
- Sweep below equal lows → then reverse up
- Quick spike above resistance → then dump
Recognizing these prevents panic selling or FOMO buying.
9. Breakouts vs Traps – Key Differences
Real breakout:
- Strong momentum candle
- Volume spike
- Follow-through
Fakeout:
- Long wick rejection
- Low volume
- Quick reversal
10. Market Cycles – Where Are We?
Crypto cycles repeat:
- Accumulation → smart money builds quietly
- Markup (bull) → euphoria
- Distribution → profit-taking
- Markdown (bear) → despair
Chart reading shines brightest when you know the cycle phase.
Final Thoughts
Charts give you probability — not prophecy. Combine structure, volume, context, and discipline.
Master this → you stop reacting and start responding.
Frequently Asked Questions
Is reading crypto charts hard for beginners?
Not with structure. Most grasp basics in weeks through consistent practice.
What chart type should beginners use?
Candlesticks — clearest visual of price action and psychology.
Can I trade crypto without charts?
Possible, but blind trading amplifies emotion and risk. Charts provide objective context.
Best timeframe for beginners?
4-hour and daily — filter noise, show real structure.
How to spot real vs fake breakouts?
Real: strong body + volume surge. Fake: weak close + rejection wick + low volume.
")
")