
")
How to Read Crypto Candlestick Charts (Beginner to Advanced Guide)
If you want to become a consistently profitable crypto trader, learning how to read candlestick charts is not optional — it is essential.
Candlestick charts reveal market psychology in real time. They show who is in control: buyers or sellers. When understood properly, they help traders identify trends, reversals, breakouts, and high-probability entry points.
This guide is part of our larger educational framework. If you’re new to crypto trading, start with our complete foundation guide here:
What Is a Candlestick Chart?
A candlestick chart is a visual representation of price movement over a specific time period. Each candle tells a story about what happened during that timeframe.
Unlike simple line charts, candlesticks provide four key data points:
- Open – The starting price
- Close – The ending price
- High – The highest price reached
- Low – The lowest price reached
This extra information allows traders to understand momentum and market sentiment.
Anatomy of a Candlestick
1. The Body
The body represents the difference between the open and close price.
- If the close is higher than the open → bullish candle
- If the close is lower than the open → bearish candle
2. The Wicks (Shadows)
Wicks show price rejection. A long upper wick signals sellers pushed price down. A long lower wick shows buyers pushed price up.
Wicks often reveal hidden market strength or weakness.
Most Important Candlestick Patterns Every Trader Must Know
1. Doji
A Doji forms when the open and close prices are nearly the same. It signals indecision between buyers and sellers.
After a strong trend, a Doji may indicate potential reversal.
2. Hammer
A Hammer has a small body and long lower wick. It appears after a downtrend and suggests buyers are stepping in.
3. Shooting Star
The opposite of a hammer. Appears after an uptrend and may signal reversal downward.
4. Bullish Engulfing
A large bullish candle completely engulfs the previous bearish candle. Strong reversal signal.
5. Bearish Engulfing
A large bearish candle engulfs the previous bullish candle. Indicates strong selling pressure.
Understanding Market Psychology Behind Candles
After nearly a decade of trading experience, one lesson becomes clear:
Candles reflect emotion.
- Large bullish candles = aggressive buying
- Large bearish candles = panic selling
- Long wicks = rejection of price levels
- Small bodies = indecision
When you stop memorizing patterns and start understanding psychology, your trading improves dramatically.
Timeframes: Which Should Beginners Use?
Each candlestick represents a timeframe:
- 1-minute
- 5-minute
- 1-hour
- 4-hour
- Daily
Beginners should focus on:
- 4-hour charts
- Daily charts
Lower timeframes create noise and emotional trading.
Common Mistakes Beginners Make
- Trading every candle they see
- Ignoring overall trend
- Using patterns without confirmation
- Overleveraging based on one signal
- Ignoring risk management
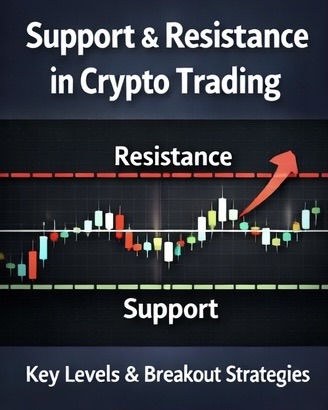
Candlestick patterns work best when combined with:
- Support and resistance levels
- Trend direction
- Volume analysis
- Indicators like RSI or MACD
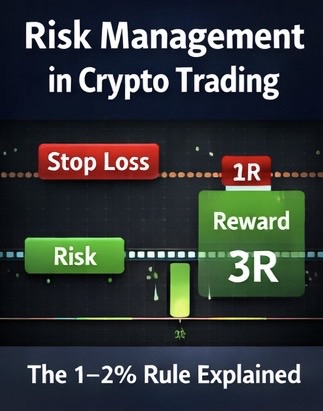
How to Combine Candlesticks with Risk Management
Never enter a trade based only on a candle pattern.
Instead:
- Identify trend direction
- Mark support/resistance
- Wait for confirmation candle
- Set stop-loss below/above structure
- Risk only 1–2% of capital
This structured approach separates professionals from gamblers.
Advanced Insight: When Patterns Fail
No pattern works 100% of the time.
Patterns fail when:
- Major news hits the market
- Volume is extremely low
- The broader trend is too strong
This is why experience and discipline matter more than memorization.
Structured Learning Recommendation
If you want a step-by-step breakdown of candlestick analysis, technical indicators, risk management, and trading psychology structured into video lessons:
Final Thoughts
Candlestick charts are the foundation of technical analysis. Mastering them takes time, observation, and disciplined practice.
Avoid rushing. Study charts daily. Combine patterns with trend analysis and risk management.
Crypto trading is a long-term skill — not a shortcut to instant wealth.
")
")