
")
50 Crypto Trading Indicators Explained for Beginners (2026 Complete Guide)
Technical indicators are powerful tools used by professional crypto traders to make data-driven decisions. This guide expands upon basic concepts, providing detailed explanations, examples, and strategies for every indicator.
Start with our beginner course before diving into advanced indicators.
Start the Free Crypto Trading Course
Table of Contents
- What Are Crypto Trading Indicators?
- How Indicators Help Traders
- Trend Indicators
- Momentum Indicators
What Are Crypto Trading Indicators?
Crypto trading indicators are mathematical calculations applied to historical price and volume data to provide insights into market behavior. They help traders identify trends, momentum, volatility, and potential reversal points.
Indicators are generally divided into categories: trend, momentum, volume, volatility, and support/resistance tools. Each serves a unique purpose and can be combined to improve trading accuracy.
How Indicators Help Traders
Indicators allow traders to make objective decisions based on market data rather than emotions. For example, they can reveal whether a trend is gaining strength or weakening, whether an asset is overbought, or where significant support exists.
Using indicators alongside real-time data, such as from our live crypto prices dashboard, can improve timing and risk management.
Trend Indicators
1. Moving Average (MA)
A Moving Average smooths out price data to identify trends over a set period. For instance, a 50-day MA averages the last 50 days of closing prices. This helps traders spot the overall market direction.
Use case: If Bitcoin’s price is above its 50-day MA, the trend is likely bullish; below it, bearish.
Tip: Longer MAs (100-day, 200-day) show major trends; shorter MAs (10-day, 20-day) show short-term trends.
2. Exponential Moving Average (EMA)
The EMA gives more weight to recent prices, making it faster to respond to price changes than a simple MA. Traders often use 12-day and 26-day EMAs for short-term trend analysis.
Use case: A 12-day EMA crossing above a 26-day EMA may indicate bullish momentum (MACD signal).
3. Moving Average Convergence Divergence (MACD)
MACD shows the relationship between two EMAs, usually 12-day and 26-day, and plots the difference as a histogram. It helps identify momentum changes and trend reversals.
Example: A MACD line crossing above the signal line often signals a buying opportunity.
4. Average Directional Index (ADX)
ADX measures trend strength on a scale of 0–100. A reading above 25 suggests a strong trend, while below 20 indicates a weak trend.
Use case: Combine ADX with MA to confirm trend direction and strength before entering a trade.
5. Parabolic SAR
Parabolic SAR places dots above or below price to signal potential reversals. Dots below the price indicate an uptrend; above the price, a downtrend.
Tip: Best used in trending markets; less reliable in sideways markets.
6. Ichimoku Cloud
Ichimoku combines multiple lines to show trend, support/resistance, and momentum. The cloud (Kumo) highlights potential future support or resistance zones.
Use case: When price is above the cloud, the trend is bullish; below the cloud, bearish.
7. Supertrend Indicator
Supertrend overlays the chart to identify trend direction and potential buy/sell signals. It adjusts according to market volatility.
8. Hull Moving Average
Hull MA reduces lag while smoothing price action. It’s particularly useful for spotting short-term trends and trend reversals.
9. Keltner Channels
Keltner Channels are volatility-based envelopes above and below an EMA. They indicate potential overbought or oversold conditions.
10. Donchian Channels
Donchian Channels plot the highest high and lowest low over a set period. Traders use them to identify breakout opportunities.
Momentum Indicators
11. Relative Strength Index (RSI)
RSI measures overbought and oversold conditions on a 0–100 scale. Above 70 = overbought, below 30 = oversold.
Tip: Combine RSI with trend indicators to avoid false signals in strong trends.
12. Stochastic Oscillator
This indicator compares closing price to a price range over a set period. It signals overbought/oversold conditions and potential trend reversals.
13. Commodity Channel Index (CCI)
CCI detects cyclical trends by measuring price deviation from its average. High positive CCI = overbought; low negative CCI = oversold.
14. Rate of Change (ROC)
ROC calculates percentage price change over a specified period, showing the speed of price movement.
15. Momentum Indicator
Momentum compares current price with past price, highlighting acceleration or deceleration in price movement.
16. Williams %R
Similar to RSI, it identifies overbought/oversold levels. It’s plotted on a -100 to 0 scale; readings above -20 indicate overbought, below -80 oversold.
17. Ultimate Oscillator
Combines short, medium, and long-term momentum into one indicator. It reduces false signals seen in single-period oscillators.
18. True Strength Index
TSI uses double-smoothed price changes to spot trends and reversals early. It’s more sensitive than RSI.
19. Know Sure Thing (KST)
KST sums multiple ROC values over different periods to capture long-term momentum.
20. Elder Ray Index
Elder Ray separates buying and selling pressure to identify potential bullish or bearish conditions.
Volume Indicators
Volume indicators measure the strength behind price movements by analyzing trading activity. In crypto markets, volume is crucial because it helps confirm trends and potential breakouts.
21. On-Balance Volume (OBV)
OBV adds volume on days when price closes higher and subtracts volume on days when price closes lower. This cumulative volume helps identify buying or selling pressure trends.
Example: If Bitcoin’s OBV is rising while price remains flat, it may indicate accumulation and an impending upward breakout.
22. Volume Profile
Volume Profile displays trading activity across price levels, not time. It highlights high-volume nodes where traders have historically entered/exited positions.
Use case: Use high-volume areas as support/resistance zones or to determine where price may consolidate.
23. Accumulation Distribution Line
This indicator evaluates whether traders are accumulating (buying) or distributing (selling) an asset. It factors in both price movement and volume.
Tip: Upward trending ADL during sideways price action can signal institutional buying, hinting at future rallies.
24. Chaikin Money Flow (CMF)
CMF combines price and volume to determine buying/selling pressure over a set period. Positive CMF suggests accumulation; negative CMF indicates distribution.
25. Volume Weighted Average Price (VWAP)
VWAP averages price weighted by volume for a trading session. Professional traders use it to determine fair value and spot potential buy/sell opportunities.
Tip: Price above VWAP = bullish sentiment; price below VWAP = bearish sentiment.
Volatility Indicators
Volatility indicators measure how much price moves over time. High volatility suggests larger swings, creating trading opportunities, while low volatility indicates consolidation.
26. Bollinger Bands
Bollinger Bands consist of a moving average with two standard deviation lines above and below. They expand and contract based on market volatility.
Example: Price touching the upper band may signal overbought conditions; touching the lower band may signal oversold conditions.
27. Average True Range (ATR)
ATR calculates the average range between high and low prices over a specified period. Traders use it to measure market volatility and set stop-loss levels.
28. Standard Deviation
Standard deviation measures how far price deviates from its mean. High values = high volatility; low values = low volatility.
29. Historical Volatility
Historical volatility calculates past price fluctuations over a period. It helps anticipate the potential range of future price movements.
30. Chaikin Volatility
This indicator measures the difference between high and low prices over time. Rising values indicate increasing volatility and potential breakouts.
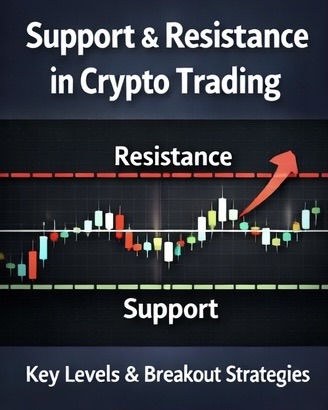
Support and Resistance Tools
Support and resistance tools help identify price levels where markets may pause, reverse, or continue. They are essential for planning entries, exits, and stop-losses.
31. Fibonacci Retracement
Fibonacci retracement uses key ratios (38.2%, 50%, 61.8%) to identify potential support or resistance during pullbacks.
Tip: Combine with trend indicators to find optimal entry points.
32. Fibonacci Extension
Extension levels project potential price targets after a breakout. Traders often use 161.8%, 261.8%, and 423.6% levels for profit-taking.
33. Pivot Points
Pivot points calculate key levels based on the previous session’s high, low, and close. They guide intraday support/resistance zones for day trading.
34. Trendlines
Trendlines connect higher lows in uptrends or lower highs in downtrends. They help identify breakout points and visualize market direction.
35. Price Channels
Channels form when price oscillates between parallel support and resistance lines. Traders buy near the lower line and sell near the upper line.
Advanced Technical Indicators
Advanced indicators provide deeper market insights. They are favored by experienced traders who combine them with basic indicators to refine strategies.
36. Market Profile
Market Profile charts display price distribution over time. They help identify value areas, high-volume nodes, and potential support/resistance zones.
37. TTM Squeeze
TTM Squeeze identifies low-volatility periods that may precede strong directional moves. When the squeeze releases, traders expect a breakout.
38. Gann Indicators
Gann indicators use geometric angles and time cycles to forecast price movements. They require careful study but can be powerful in timing entries/exits.
39. Elder Impulse System
This system combines moving averages with MACD to detect bullish/bearish impulses. It helps traders spot trend acceleration or weakening.
40. Fisher Transform
Fisher Transform converts price into a Gaussian distribution to highlight extreme turning points. It is used to anticipate reversals with higher accuracy.
More Advanced Indicators Used by Crypto Traders
These indicators are more specialized and often used by experienced traders to refine timing, detect market structure, or measure hidden momentum.
41. Linear Regression Indicator
Linear Regression fits a straight line through historical price data to highlight the overall trend. The slope indicates trend direction, while deviations from the line show potential reversals.
Use case: Identify if Bitcoin is trending strongly upward or moving sideways. Deviations beyond the regression line can act as buy/sell signals.
42. Z-Score Indicator
Z-Score measures how far price deviates from its historical average. High positive values may indicate overbought conditions, while large negative values may indicate oversold conditions.
43. Adaptive Moving Average (AMA)
Adaptive MA adjusts sensitivity based on volatility. It reacts faster during market swings and smooths out noise during quiet periods.
44. Fractal Indicator
Fractals identify recurring price patterns. They are often used with trend indicators to confirm potential turning points.
45. ZigZag Indicator
ZigZag filters minor price fluctuations and highlights major swings, making long-term trends easier to spot.
46. Heikin Ashi Candles
Heikin Ashi smooths candlestick data to show trend direction more clearly. It reduces noise, making reversals easier to identify.
47. Balance of Power (BOP)
BOP measures buying vs selling pressure within each candle. Positive values indicate dominant buyers, negative values indicate dominant sellers.
48. Klinger Oscillator
Klinger combines price and volume to identify long-term trends and short-term reversals. It’s useful for detecting hidden accumulation or distribution.
49. Detrended Price Oscillator (DPO)
DPO removes long-term trends to focus on shorter-term cycles. Traders use it to identify highs and lows within shorter market swings.
50. Aroon Indicator
Aroon measures the time since the last high or low. It helps determine whether a trend is strengthening or weakening.
Best Indicator Combinations for Crypto Trading
Professional traders rarely rely on a single indicator. Combining indicators from different categories helps confirm signals and reduce false alarms.
Trend + Momentum Strategy
- Moving Average (Trend)
- RSI (Momentum)
This combination helps identify strong trends while avoiding entries during overbought/oversold conditions.
Trend + Volume Strategy
- Moving Average (Trend)
- OBV (Volume)
Use this to confirm whether trends are supported by real trading activity.
Volatility Breakout Strategy
- Bollinger Bands (Volatility)
- ATR (Volatility)
Identify breakout opportunities when volatility expands after consolidation.
Common Mistakes Beginners Make With Indicators
Using Too Many Indicators
Adding too many indicators can create “analysis paralysis.” Stick to 2–3 complementary indicators for clarity.
Ignoring Market Context
Indicators should be interpreted within broader market trends. Overbought RSI in a strong uptrend may not trigger a sell.
Not Using Risk Management
No indicator guarantees profits. Always combine signals with stop-losses, position sizing, and diversification.
How Professional Traders Use Indicators
Successful traders combine indicators with price action, market structure, and risk management. They focus on building a consistent trading system rather than chasing a “perfect” indicator.
They backtest strategies on historical data and adjust based on performance. Patience, discipline, and market understanding are key.
Our free course teaches chart analysis, trading psychology, and advanced strategies.
Start the Free Course
Related Crypto Trading Guides
Final Thoughts
Technical indicators are essential tools that provide insights into trends, momentum, volatility, and market structure. From simple moving averages to advanced oscillators, each has its role in a trader’s toolkit.
Successful trading is not about using all indicators but mastering a few and combining them effectively. Always integrate proper risk management and adapt strategies to market conditions.
With discipline, practice, and the right indicators, you can make informed, strategic decisions in the fast-moving crypto market.
")