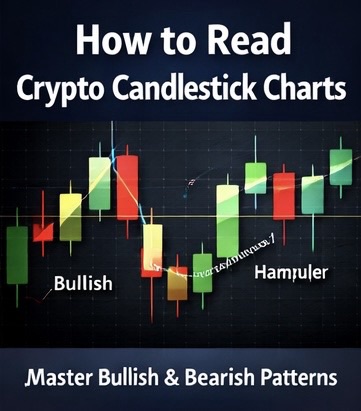


If you want to trade crypto successfully, you must understand candlestick patterns.
Candlestick charts tell a story, they reveal who is in control of the market: buyers or sellers. Once you learn how to read them, you stop guessing and start trading with logic.
In this guide, you’ll learn
• What candlestick patterns are
• How to read a single candle
• The most powerful bullish patterns
• The strongest bearish patterns
• How to use candlesticks with indicators
• Mistakes beginners must avoid
Let’s break it down.
What Are Candlestick Patterns?
Candlestick patterns are visual formations on price charts that show market psychology.
Each candle represents price movement within a specific time period (1 minute, 1 hour, 1 day, etc.).
Candlesticks originated in Japan over 200 years ago, and today they are the foundation of technical analysis in crypto, forex, and stocks.
How to Read a Single Candlestick
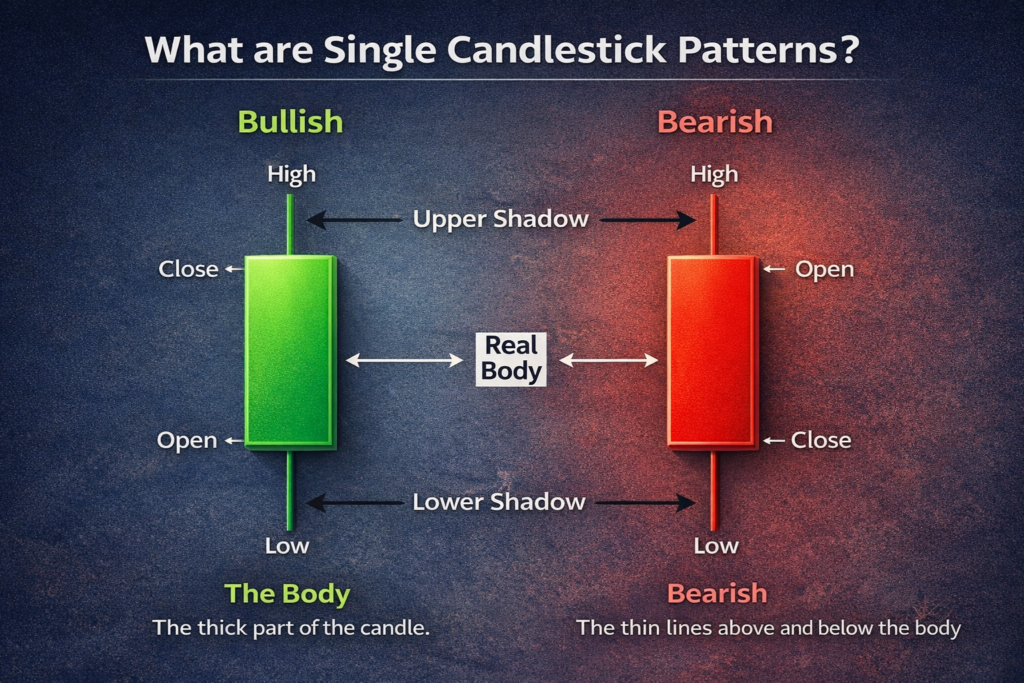
Every candlestick has 4 main parts:
• Open price
• Close price
• High
• Low
Body
The body is the thick part of the candle.
Green (or white) white body = price closed higher than it opened
Red (or black) body = price closed lower than it opened
Wick (or Shadow)
The wick is the thin lines above and below the body of a candle.
• Top wick = highest price during the time period
• Bottom wick = lowest price during the time period
Long wicks (or shadows) indicate contention between buyers and sellers, like a tug-of-war. If the wick is long at the top, sellers are tryin’ to push price down. If it’s at the bottom, buyers are pushin’ price up.
Enhance your crypto trading skills with our free tutorial videos on candlestick patterns & strategies, available on Baeolah Crypto Learning Hub.
Bullish Candlestick Patterns (Buy Signals)
The following candlestick patterns suggest price may move upward(time to buy):
1. Hammer
The hammer candlestick pattern has a small body with a long lower wick.
The hammer is a bullish reversal signal. That long lower wick shows that sellers pushed price down but buyers are stepping in, pushing it back up. Best used at the bottom of a downtrend.
2. Bullish Engulfing
A large green candle that completely covers the previous red candle.
The bullish engulfing means buyers have taken control, overpowering sellers. Often a sign of a potential bullish trend reversal. It’s an even better signal if It appears at a support level.
3. Morning Star
The morning star candlestick pattern is a three-candle pattern with a Large red candle, Small indecision candle, and a Large green candle. And often indicates a trend reversal from bearish to bullish(buyers are dominating)
Bearish Candlestick Patterns (Sell Signals)
These patterns suggest price may fall(when to sell).
1. Shooting Star
The shooting star is a bearish reversal signal, indicating potential trend shift. Buyers tried to push price higher, but sellers stepped in, rejecting the higher price. Best used with other indicators, at the top of an uptrend.
2. Bearish Engulfing
The bearish engulfing candlestick pattern, is a large red candle that completely covers the previous green candle. Means Sellers are now dominant. Often a sign of a potential downtrend.
3. Evening Star
The evening star is a bearish reversal candle pattern, typically seen at the top of an uptrend. They’re three candles: a big green, a small-bodied candle (doji or spinning top), and a big red candle. Means buyers are losing steam, and sellers are taking over(Potential reversal from bullish to bearish).
The Most Important Rule Most Traders Ignore
Candlestick patterns do NOT work in isolation.
A hammer candlestick pattern in the middle of nowhere is weak. But a hammer at a strong support, Trendline, Moving average, and Fibonacci level is quite powerful.
Always combine candlesticks with confluence(Support & resistance, Volume, RSI, Moving averages) to increases win rate.
Timeframes Matter
Patterns on 1-minute chart = noisy, unreliable
5-minute chart = short-term scalping
1-hour chart = intraday
4-hour chart = strong swing signals
Daily chart(1Day) = strongest signals
Basically higher timeframes = stronger patterns.
Common Mistakes Beginners Make
Here are some common mistakes beginners make. Avoid these mistakes like a plague.
• Trading every pattern they see
• Ignoring trend direction
• Using high leverage
• Not waiting for confirmation
• No stop loss
How to Practice Candlestick Patterns
Here’s how to improve fast
Open a demo trading account, Scroll on charts, Identify patterns, Mark them, then wait and see what happened next. Chart replay is a powerful training.
Enhance your crypto trading skills with our free tutorial videos on candlestick patterns & strategies, available on Baeolah Crypto Learning Hub.
Frequently Asked Questions About Candlestick Patterns
1. Do candlestick patterns really work in crypto trading?
Yes, but only when used correctly.
Candlestick patterns work because they reflect market psychology. Every candle shows a battle between buyers and sellers. When certain patterns form repeatedly over time, they create recognizable signals.
However, patterns are most effective when combined with Support and resistance, Volume confirmation, RSI or moving averages, Higher timeframe trend direction.
Blindly trading every pattern without confirmation leads to losses.
2. Which candlestick pattern is the most reliable?
There is no single “magic” pattern.
However, traders often consider these high-probability setups, Bullish Engulfing at strong support level, Bearish Engulfing at resistance level, Hammer after a strong downtrend, Shooting Star after a strong uptrend.
The reliability increases when the pattern appears on the 4H or Daily timeframe, Volume increases during formation, It aligns with overall trend structure
In other words context matters more than the pattern itself.
3. Are candlestick patterns better on higher timeframes?
Yes.
Higher timeframes (4H, Daily, Weekly) are more reliable because they filter out market noise.
Lower timeframes like 1-minute or 5-minute often produce false signals due to volatility and scalping activity.
If you’re a beginner, you should focus on 1H, 4H, and Daily(1D) timeframe. They provide clearer structure and stronger confirmations.
4. Can I trade using only candlestick patterns?
Technically yes, but it is not recommended.
Professional traders combine Market structure, Trend direction, Risk management, and Position sizing.
Candlesticks help you fine-tune entries, not predict the future. Think of them as confirmation tools, not standalone strategies.
5. What is the biggest mistake beginners make with candlesticks?
The biggest mistake is trading without context.
Common errors include
• Ignoring overall trend
• Entering trades without stop loss
• Using too much leverage
• Trading every hammer or engulfing pattern
• Not waiting for candle close confirmation
PS discipline matters more than pattern recognition. Position sizing & risk management + discipline > pattern recognition. Patterns are useful, but without discipline, they’re just pretty pictures.
6. How long does it take to master candlestick trading?
It depends on how often you practice, whether you journal trades, do you backtest strategies, your emotional control, your risk management.
With consistent study and practice, traders can become confident in 3–4 months. But true mastery takes experience in different market conditions.
How to Start Learning Candlestick Trading Properly
If you’re serious about improving your trading skills, structured learning is important.
On Baeolah, we are building a complete Crypto Learning Hub where you can learn for free
• Chart reading fundamentals
• Support & resistance mastery
• Risk management strategies
• High-probability trading setups
• Beginner-friendly crypto tutorials
👉 Visit our Crypto Learning Page to start learning step-by-step for free.👉 Baeolah Crypto Learning Hub.
Advanced Tip: Combine Patterns With Market Structure
Here’s what separates average traders from profitable ones
They don’t just look for patterns, they ask important questions.
• Is the market trending or ranging?
• Are we at a key support or resistance zone?
• Is volume confirming the move?
• Are higher timeframes aligned?
For example, a hammer inside a strong downtrend is weak. But a hammer at a weekly support after a pullback?That’s powerful. This is called confluence, when multiple factors align.
Confluence increases probability, Probability increases consistency, Consistency builds profitability.
Final Thoughts
Candlestick patterns help you understand market psychology. They are not magic, but they’re are tools.
When combined with discipline, risk management, and confirmation indicators, they can significantly improve your trading decisions.
• Master candles.
• Master entries.
• Control risk.
• Reduce emotional decisions
That’s how consistency is built.
Mastering candlestick patterns won’t make you rich overnight, But mastering risk management + confirmation + patience? That changes everything.
Candlestick patterns are one of the most powerful tools in crypto trading, helping traders identify trend reversals, continuation setups, and high-probability entry points. Whether you are trading Bitcoin, Ethereum, or altcoins, understanding candlestick signals can improve your technical analysis and overall decision-making.
Enhance your crypto trading skills with our free tutorial videos on candlestick patterns & strategies, available on Baeolah Crypto Learning Hub.
Candlestick patterns are used in crypto, forex, and stock market trading.
Related Articles:
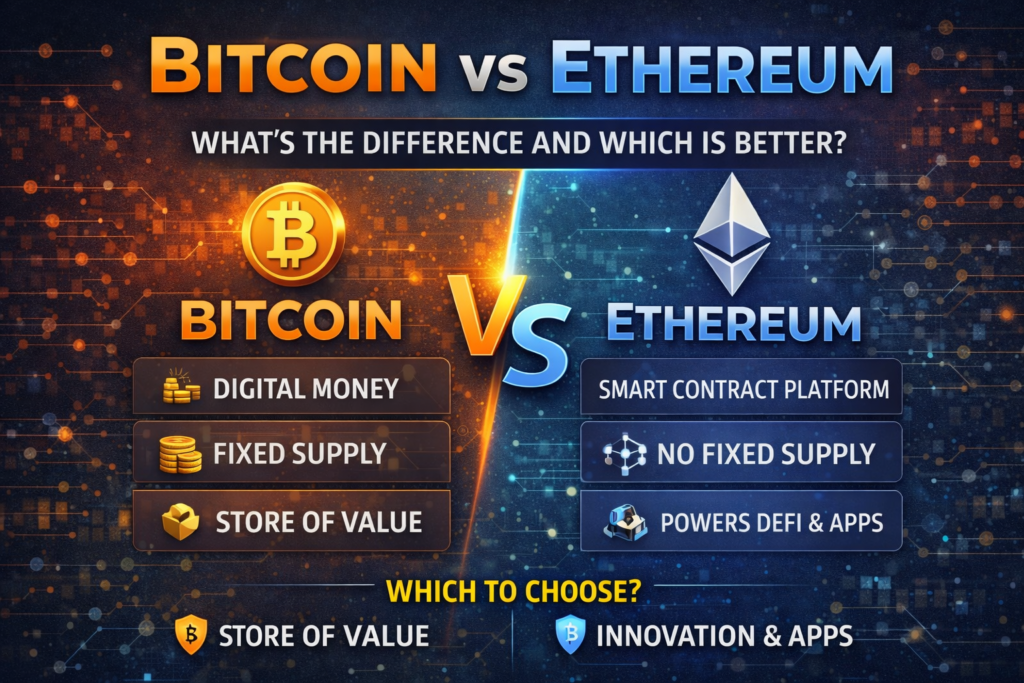
• Bitcoin vs Ethereum: What’s the Difference and Which Is Better?
• Best Crypto Exchanges in Nigeria (2026 Beginner-to-Pro Guide)